Stop Loss PanelHere is a label panel that shows the stop-loss number for Long or Short trades based on volatility using average true range and and a mult of that.
Cari dalam skrip untuk "stop loss"

ATR Stop Loss FinderThis Indicator uses Average True Range (ATR) to determine a safe place to put stop losses to avoid being stop hunted or stopped out of a trade due to a tight stop loss. Default multiplier setting is 1.5. For a more conservative stop loss use 2 and for a tighter stop loss use 1. ATR and stop loss prices are displayed in table at bottom of screen. Use high(red) for shorts and low(teal) for longs.

Anti-Volume Stop LossFINALLY!
As everyone who tried to create, understand, or even find the Buff Pelz Dormeier Anti-volume stop-loss indicator knows that - it's not easy. Personally, I have partially, or perhaps completely figured out, the tips Buff had given in Investing with Volume Analysis book.
AVSL now is ready.
Please do some test and give me a feedback how it works in your trade strategy.
Anti-Volume stop loss - AVSL
from Investing with Volume Analysis book CHAPTER 20 • RISKY BUSINESS 253-256:
"It is important in any risk-management process to predetermine an objective decision point level (a stop loss) to exit, thereby protecting principal in case you are wrong. My objective sell point is determined by using a quantitative formula I refer to as Anti-Volume Stop Loss (AVSL). Having a quantitative, yet intelligent sell point eliminates the emotional struggles involved in deciding when to exit a position.
AVSL is a technical methodology that incorporates the concepts of support, volatility, and, most importantly, the inverse relationship between price and volume. The AVSL combines the concepts of the VPCI (Volume Price Confirmation Indicator) and John Bollinger’s Bollinger Bands to create a trailing stop loss.
AVSL = Lower Bollinger Band – (Price, Length, Standard Deviation)
Where:
Length = Round (3 + VPCI)
Price = Average (Lows × 1 / VPC × 1 / VPR, Length)
Standard Deviation = 2 × (VPCI × VM)
One of the most difficult decisions is determining what one’s maximum loss threshold should be. Some say 2 percent; others say 20 percent. I believe the more volatile a security, the looser the stop should be. A nonvolatile security, such as Coca-Cola, might move 7 percent a year, while a volatile security such as Google might move 7 percent in a day. If you use a 7 percent stop for Coca-Cola, it might take a year to be stopped out while the security underperforms.
However, if you use 7 percent for Google, you can be stopped out intraday, not allowing the investment an opportunity to develop. By using the lower Bollinger Band of the securities lows, the AVSL considers each individual security’s own volatility. Thus, a volatile security would be granted more room of the stocks low while a stable security would have a tighter leash (see Figure 20.7).
The next important step is employing the price-volume relationship into the calculation. Volume gauges the power behind price moves. In accounting for this, when a security is in an uptrend and has positive volume characteristics, it is given more room. However, if the security exhibits contracting volume characteristics, then the stop is tightened. In this way, if a negative news event affects an unhealthy security, the stop is tighter, thus preserving more of your profits.
However, if the negative news event affects a security whose price-volume relationship is healthy, the stop has been loosened, avoiding the temporary whipsaw of an otherwise strong position. In these ways, AVSL lets the market decide when to exit your position.
AVSL tailors each security for support, volatility, and the pricevolume relationship based on an investor’s time frame as calculated from the chart data. For example, my portfolio positions are continually re-evaluated with this AVSL methodology, which yields the possibility of raising the decision point threshold periodically based on the time frame of my investment objective. With my short-term Giddy-up portfolios, I use daily chart data and seek to raise my maximum loss stop on a daily basis.
My intermediate ETF and stock positions are calculated off of weekly data and then re-evaluated weekly. With my longer term stock portfolios, the decision point is calculated off data revised monthly. This analytical approach that uses measurable facts over emotion or gut instincts allows me to maintain my objectivity. Thus objectivity, not emotion, informs my investment decisions."
How look mine AVSL:
Price component = low × 1/VPC × 1/VPR : for VPC > 1 and VPC < -1 | low × 1 × 1/VPR : for 1 > VPC > 0 | low × -1 × 1/VPR : for 0 > VPC > -1
AVSL Price = sma((low × 1/VPC × 1/VPR) , length) / 100
length = round : for VPCI > 0 | round [ absolute ] : for VPCI < 0 | 3 : for VPCI=0
Standard Deviation = mult × VPCI × VM)
AVSL = sma(Actual low price - AWSL Price + Standard Deviation, 26)
It's hard to say is it the same as in Buff Pelz Dormeier book, but I encourage you to modify the script for better results.

Double EMA with stop loss indicatorThis is an updated version of my previous stop loss script.
I've added a double EMA line and modified the stop as below;
In an uptrend....
1. a yellow dot will appear once it's time to move your stop. The yellow dot will display at the level of the stop loss. Place your stop 1 pip below the dot.
2. The yellow dot will only appear if a new higher low has formed and has been confirmed. Also the current candle must have broken the high of a previous bullish candle or the dot will not appear.
3. The dot will also appear if there is a likely reversal of the current trend.
Also works in downtrends.....

Binque's Stop Loss IndicatorBinque's Stop Loss Indicator is a great way to visualize a trailing stop loss based on a percent from the high. i.e. If the high was $10 of a trading day and your stop loss was set at 5% (percent) then your chart would show a small dot 5% below the high of the day. This is a great way to quickly see a trailing stock idea. Change the color to match your back ground. Adjust your trailing stop loss to fit your trading style.
Note: This indicator is calculated off of the daily high.

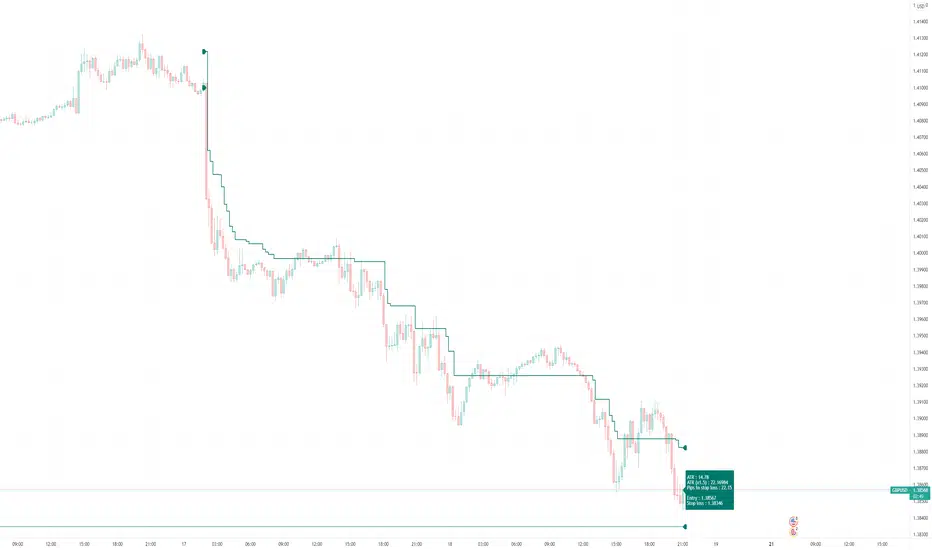
ATR+ (Stop Loss Indicator)This script is designed to aid in back-testing and trade execution.
It displays three sets of values - the teal colored value is the current ATR, the green colored value is your stop loss distance (in pips) below the most recent swing low for long trades , and the red colored value is your stop loss distance (in pips) above the most recent swing high for short trades .
You can change the stop loss settings to base your stop loss on a set pip amount or by however many multiples of the current ATR as you wish (eg. 1.5x ATR).
Feel free to ask any questions or edit the script without permission :)
- Matt.

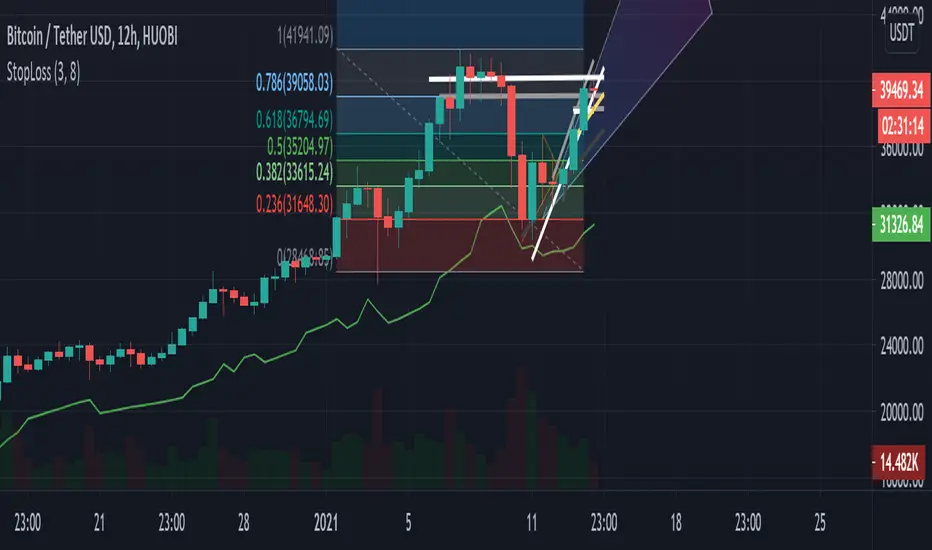
Safe stop-loss (12h)Where to put your stop-loss to avoid accidental exit. Configure your risk level. If you are in a long position and significant profit, increase the parameters to reduce the risk of accidental exit.
Fixed Percent Stop Loss & Take Profit % - For Study Scripts===========
Fixed Percent Stop Loss & Take Profit % - { FOR STUDY SCRIPTS! }
===========
A neat example of how to set up Fixed Stops and Take Profit as a percent of the entry price - This is for setting Alerts within your own Study Script for when either your SL or TP get hit.
Yup, that's about it!
You can ignore the actual entry/exit orders - they're based on a simple MA cross and are therefore NOT relevant, NOT profitable and NOT recommended!
You should be using this code as a way of adding Stops and Takes to your own scripts - hope it helps!
Set your "Open Long/Short" Alerts to be triggered "Once per Bar Close" - Set your "SL/TP" Alerts to trigger "Once per Bar".
--
We wrote this with a bit of a rush on! ~ If you spot any mistakes/bugs just let us know and we'll get round to them asap!
-----------
Good Luck and Happy Trading!


Stop Loss & TargetHow to Use the SL/TP Indicator
The SL/TP indicator is a versatile tool designed for traders to easily visualize entry, stop-loss (SL), and take-profit (TP) levels on their charts. This guide will walk you through the steps to configure and use the indicator effectively.
Features:
Configure Long Trades and Short Trades independently.
Define Entry Price, Stop Loss, and up to three Take Profit levels for each trade.
Customize line colors for better visualization.
Works for both risk-reward and target-based trading.
Adding the Indicator:
Open the TradingView platform.
Search for the indicator name: SL/TP.
Click the Add to Chart button to apply it.
Configuration:
1. Long Trade Settings
Enable Long Trade: Check this option to activate long trade lines on the chart.
Long Entry Price: Input the price at which you plan to enter the long trade.
Long Stop Loss: Input your stop-loss level for the long trade.
Line Colors: You can customize the colors for the Entry, SL, and TP lines in the Long Trade settings group.
Take Profit Levels (Calculated Automatically):
TP1: 1:1 Risk-Reward ratio (difference between Entry and SL added to Entry).
TP2: 1:2 Risk-Reward ratio.
TP3: 1:3 Risk-Reward ratio.
2. Short Trade Settings
Enable Short Trade: Check this option to activate short trade lines on the chart.
Short Entry Price: Input the price at which you plan to enter the short trade.
Short Stop Loss: Input your stop-loss level for the short trade.
Line Colors: You can customize the colors for the Entry, SL, and TP lines in the Short Trade settings group.
Take Profit Levels (Calculated Automatically):
TP1: 1:1 Risk-Reward ratio (difference between Entry and SL subtracted from Entry).
TP2: 1:2 Risk-Reward ratio.
TP3: 1:3 Risk-Reward ratio.
Visualizing on the Chart:
Once you configure the settings and enable the trade, the indicator will draw horizontal lines on the chart for:
Entry Price
Stop Loss
Take Profit Levels (TP1, TP2, TP3)
Each line will extend to three bars ahead of the current bar index.
Customization:
Adjust colors for better visibility depending on your chart theme.
The width and style of lines can also be modified in the source code if needed.
Example Usage:
Long Trade Example:
Enable Long Trade: Check the box.
Set Entry Price: 100.
Set Stop Loss: 95.
The indicator will draw the following lines:
Entry Line: At 100 (customizable color).
Stop Loss Line: At 95 (customizable color).
TP1 Line: At 105 (1:1 Risk-Reward).
TP2 Line: At 110 (1:2 Risk-Reward).
TP3 Line: At 115 (1:3 Risk-Reward).
Short Trade Example:
Enable Short Trade: Check the box.
Set Entry Price: 200.
Set Stop Loss: 205.
The indicator will draw the following lines:
Entry Line: At 200 (customizable color).
Stop Loss Line: At 205 (customizable color).
TP1 Line: At 195 (1:1 Risk-Reward).
TP2 Line: At 190 (1:2 Risk-Reward).
TP3 Line: At 185 (1:3 Risk-Reward).
Notes:
Ensure that you input valid and realistic price levels for Entry and Stop Loss.
The indicator will only display lines if both the Entry Price and Stop Loss are non-zero.
Use this indicator for planning trades visually but always confirm levels with your trading strategy.
Disclaimer: This indicator is a tool to assist in trading. Use it with proper risk management and your own due diligence.

Stop Loss Advisor📊 Stop Loss Advisor - Advanced Risk Management Tool
A sophisticated Pine Script v5 indicator designed to suggest optimal stop loss distances based on market volatility, combining ATR and Standard Deviation analysis for precise risk management.
🎯 What Makes This Different from Bollinger Bands?
While Bollinger Bands focus on mean reversion and overbought/oversold conditions using a moving average center line, this indicator is specifically designed for risk management . It creates dynamic bands around the current price to suggest where NOT to place your stop loss, preventing you from being stopped out by normal market noise.
⚡ Key Features
Dynamic ATR Calculation - Fully customizable ATR periods with adaptive volatility filtering
Standard Deviation Integration - Optional StdDev component for enhanced statistical accuracy
Multiple Combination Modes - Average, Maximum, ATR Weighted, or StdDev Weighted
Flexible Price Sources - Choose from Close, HL2, HLC3, or OHLC4
Automatic Pip Calculation - Works across all instruments with automatic pip value detection
Smart Alerts System - Get notified when suggested stop loss exceeds your base risk tolerance
Real-time Information Table - Displays current values and risk status
Visual Labels - Shows exact pip distances directly on chart
Band Smoothing - Prevents erratic movements with customizable averaging
📈 How It Works
ATR Analysis : Calculates Average True Range to measure current market volatility
Statistical Enhancement : Optionally combines with Standard Deviation for more robust calculations
Dynamic Bands : Creates upper and lower bands that expand/contract with volatility
Pip Conversion : Automatically converts distances to pips for easy interpretation
Risk Assessment : Compares suggested distances with your base stop loss tolerance
🔧 Customization Options
ATR Settings:
Customizable ATR period (default: 14)
Adjustable multiplier with 0.1 step precision
Optional volatility filtering for enhanced sensitivity
Standard Deviation (Optional):
Independent period and multiplier settings
Multiple price source options
Four combination modes with ATR
Visual Customization:
Fully customizable colors for all elements
Multiple line styles (solid, dashed, dotted)
Optional band filling with transparency control
Show/hide ATR line overlay
Configurable band smoothing
💡 Perfect For
Forex Traders - Especially effective on major pairs and XAUUSD
Risk Managers - Calculate optimal stop distances before entering trades
Scalpers - Avoid being stopped out by normal market fluctuations
Swing Traders - Adapt stop losses to current volatility conditions
📊 Indicator Values
The information table displays:
Current ATR Value (in pips)
Suggested Long Stop Loss (distance in pips)
Suggested Short Stop Loss (distance in pips)
Risk Status - "SAFE" or "HIGH RISK" based on your base tolerance
Standard Deviation Value (when enabled)
Combination Method (when using both ATR and StdDev)
⚠️ Important Notes
This indicator suggests minimum stop loss distances, not entry/exit signals
Always combine with your trading strategy and risk management rules
Do not use as a standalone trading system
Backtesting recommended before live implementation
Default settings work well for most scenarios, but optimization is encouraged
🎨 Default Configuration
ATR Period: 14
ATR Multiplier: 2.0
Price Source: Close
Base Stop Loss: 20 pips
Band Smoothing: 3 periods
Standard Deviation: Optional (20 period, 2.0 multiplier)
🚀 Getting Started
Add the indicator to your chart
Set your base stop loss tolerance in the settings
Choose your preferred price source and ATR parameters
Enable Standard Deviation for enhanced accuracy (optional)
Monitor the information table for real-time risk assessment
Use the suggested distances as minimum stop loss levels
Pro Tip: In low volatility markets, the bands will contract suggesting tighter stops. In high volatility periods, they expand warning you to use wider stops to avoid being stopped out by normal price action.
📝 Version History & Updates
This indicator is actively maintained and updated based on user feedback. Future enhancements may include multi-timeframe analysis, trend-based asymmetric bands, and additional statistical measures.
Transform your risk management approach with data-driven stop loss suggestions that adapt to real market conditions!

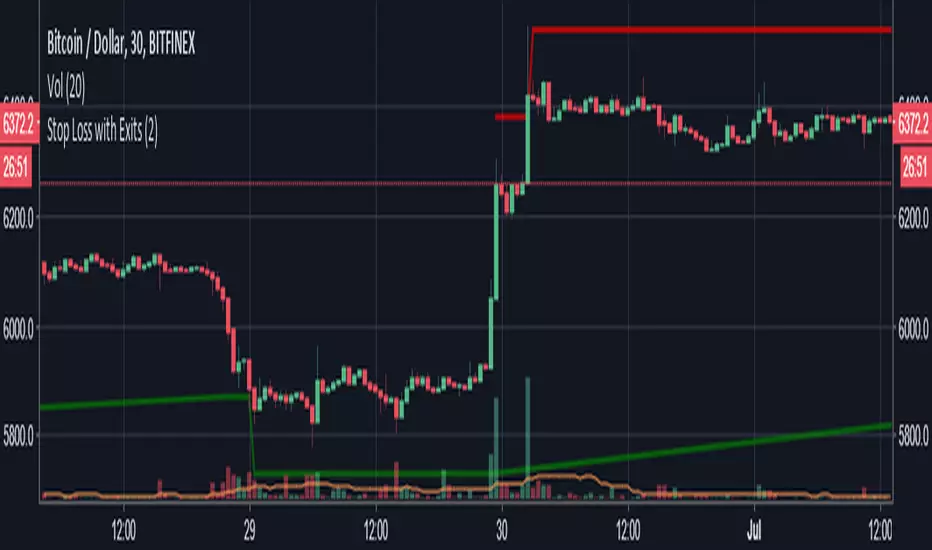
Stop-Loss order according to Average PenetrationAs a engineer, the view of signal and noise in the book of "Trading for a living"really interests me. For a trader the biggest issue is when should we enter and exit the market. The view of safety range stop loss may help to solve this problem for some beginner and give you a new idea of stoploss for you trade system
Here is the content from Trading for a Living
you may use the slope of a 22-day EMA to define the trend. You need to choose the length of the lookback period for measuring noise level. it has to be long enough to track recent behavior but short enough to be relevant for current trading. A period of 10 to 20 days works well, or we can make our lookback period 100 days or so if we want to average long-term market
if the trend is up, mark all downside penetrations during the look-back period, add their depths, and divide the sum by the number of penetrations。 This gives you the Average Downside Penetration for the selected look back
if today's low is lower than yesterday's, do not move your stop lower since we are only allowed to raise stops on long positions, not lower them
Reverse these rules in downtrends. When a 22-day EMA identifies a downtrend, count all the upside penetrations during the look-back period and find the Average Upside Penetration. Multiply it by a coefficient, starting with two. When you go short, place a stop twice he Average Upside Penetration above the previous day's high. Lower your stop whenever the market makes a lower high, but never raise it.
The important thing when you make an order is to hold your earning during a trending scenario. To avoid stopping loss by the variance in the market and to avoid big loss if the market shift to another direction in a short time.
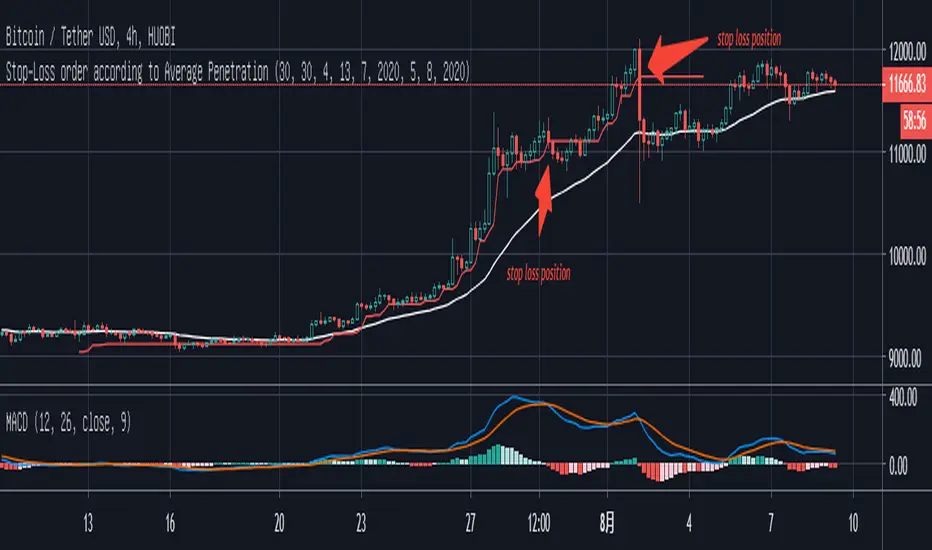
From the graph there, I select the most recent trend up period in the Bitcoin and adjust the parameters according to this trend.
As you can see, the stop loss is away from the lowest price in bar, so that you will not be forced to exit the trade by small turbulence. You can hold your order and need to worry about missing the trend. But there are always sharp plunges in the uptrend. you can see two cursors on the graphic. The stop loss will help you avoid this plunge.
But in my opinion, this will be the hard stop loss in your trade. Help you to keep profit and avoid big loss. To maximize the profit, you had better to build you own strategy.
When I try to create this indicator, it is found that two rule for this indicator
1. you had better to use it in a clear trend range. Since the stop loss can only be higher in a long condition and lower in a short condition. If you use it in a volatile market., then stop loss doesn’t make any senses.
2. you need to adjust those parameters according to the market and the trend you are in. Some people like to avoid big loss, you can set them this depending on you experience
Last, this is getting from the view in the book, i didn’t do any back test for it. So please be careful to use it and let me know if you have any suggestions or ideas.
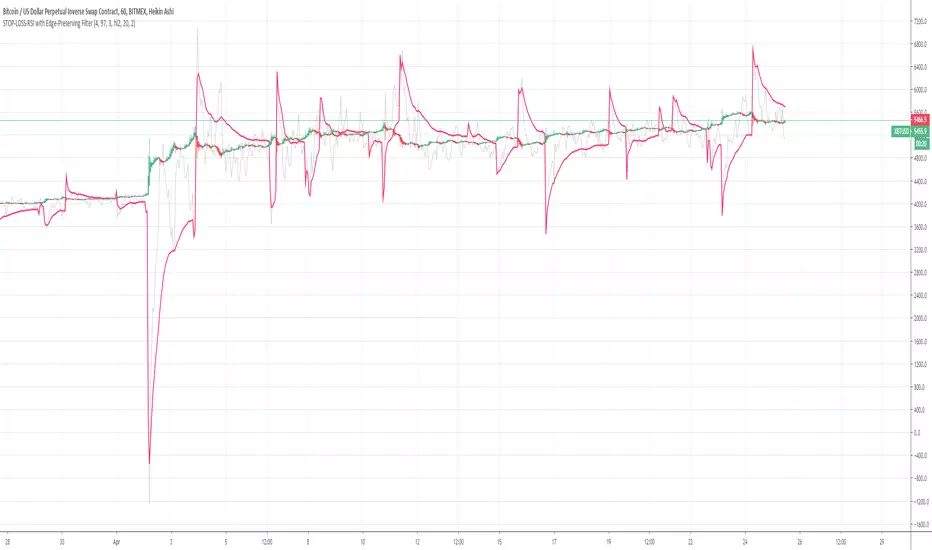
STOP-LOSS-RSI with Edge-Preserving FilterThe is a modified RSI line, with a true overlay. It can be used for entries and exits or stop-loss.
The idea came from Alexgrover.
The first part of the code, RSI, was taken from J.Dow's code of Supertrend and RSI.
While the second part of the code was taken from Alexgrover's code "Edge-Preserving Filter".
The silver line was the original RSI line while the red line is the modified RSI line.
Hope it helps, I know I need it.
Stop Loss / Take Profit Table// (\_/)
// ( •.•)
// (")_(")
📈 Introducing the Stop Loss / Take Profit Table Indicator! 📈
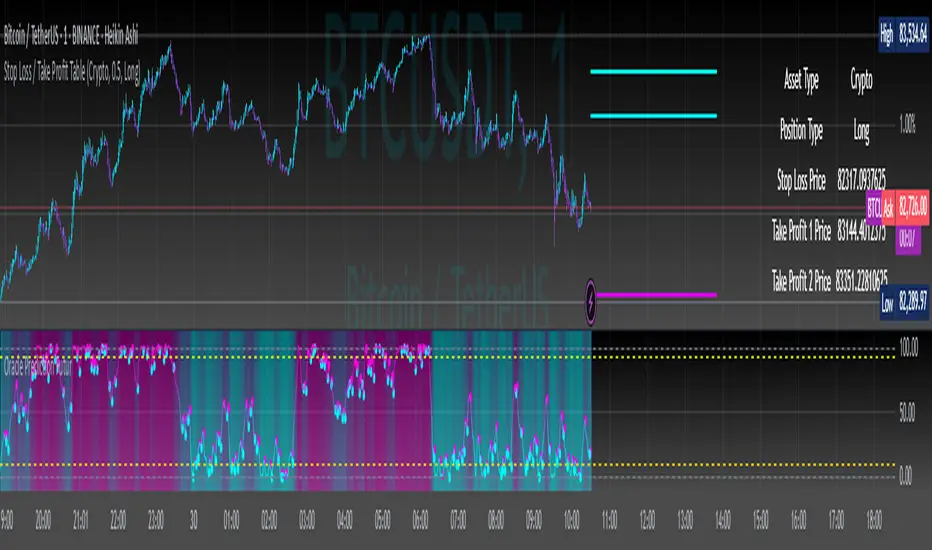
Enhance your trading strategy with our powerful Stop Loss / Take Profit Table indicator, designed for traders in the Crypto, Stock, and Forex markets. This easy-to-use tool helps you manage risk and maximize profits by clearly displaying your Stop Loss and Take Profit levels based on your trading position.
Key Features:
Custom Asset Types: Choose between Crypto, Stock, or Forex to tailor the indicator to your specific trading style.
Dynamic Stop Loss & Take Profit Calculation: Set your desired Stop Loss percentage, and the indicator will automatically calculate your Stop Loss and two Take Profit levels based on different timeframes (1 min to 240 min).
Position Type Flexibility: Whether you're trading Long or Short, the indicator adjusts the calculations accordingly, providing you with precise price levels for effective risk management.
Visual Representation: Stop Loss and Take Profit levels are marked directly on the chart with distinctive horizontal lines in vibrant colors for easy reference.
Informative Table Display: A dedicated table displayed on the chart shows your asset type, position type, and calculated prices for Stop Loss and Take Profit levels, ensuring you have all critical data at a glance.
Alert Notifications: Stay informed with optional alerts that signal when your Stop Loss or Take Profit levels are hit, allowing you to react swiftly in fast-moving markets.
Why Use This Indicator?
Managing your trades is critical for success in the financial markets. With our Stop Loss / Take Profit Table, you can easily set your parameters and visually track your risk and reward levels, making it a practical addition to any trader's toolkit.
Get started today and take control of your trading strategy! ✨
Happy trading! 📊🚀
Stop Loss With Average True Range (ATR)Stop Loss With Average True Range (ATR)
It simplifies the calculation of stop loss price for stop loss method using the average true range (ATR).
For example;
You want to stop loss below 3 ATR. Let's assume the price is 100, the average true range is 5. You will multiply the average true range by 3 and subtract from the price and enter a stop loss order at the 85 price you have reached. Instead of doing this calculation every time, you just need to use this script and set the multiplier to 3. A stop loss line will be drawn below the price candles.
You can set the method to be used when averaging the true range. Methods you can use to average: EMA (exponentially moving average), HMA (hull moving average), RMA (moving average used in RSI), SMA (simple moving average), SWMA (symmetrically weighted moving average), VWMA (volume-weighted moving average), WMA (weighted moving average).
You can set the length to be used when averaging the true range.
You can set the multiplier to be used when determining the stop loss price.
Turkish
Ortalama Gerçek Aralıkla (ATR) Zarar Durdurma
Gerçek aralığın ortalamasını kullanarak zarar durdurma yöntemi için zarar durdurma fiyatının hesaplanmasını kolaylaştırır.
Örneğin;
3 ATR kadar aşağıda zarar durdurmak istiyorsunuz. Fiyatın 100, ortalama gerçek aralığın 5 olduğunu varsayalım. Ortalama gerçek aralığı 3 ile çarparak fiyattan çıkaracaksınız ve ulaştığınız 85 fiyatına zarar durdurma emri gireceksiniz. Bu hesabı her seferinde yapmak yerine bu betiği kullanmanız ve çarpanı 3 olarak ayarlamanız yeterli. Bu sayede fiyat mumlarının altına zarar durdurma çizgisi çizilecektir.
Gerçek aralığın ortalaması alınırken kullanılacak yöntemi ayarlayabilirsiniz. Ortalama almak için seçebileceğiniz yöntemler: EMA (üstel hareketli ortalama), HMA (gövde hareketli ortalama), RMA (göreceli hareketli ortalama), SMA (basit hareketli ortalama), SWMA (simetrik ağırlıklı hareketli ortalama), VWMA (hacim ağırıklı hareketli ortalama), WMA (ağırlıklı hareketli ortalama).
Gerçek aralığın ortalaması alınırken kullanılacak periyot uzunluğunu ayarlayabilirsiniz.
Zarar durdurma fiyatını belirlerken kullanılacak çarpanı ayarlayabilirsiniz.

Stop Loss vs Take Profit Probability and EVThis stop loss and take profit calculator uses a Monte Carlo simulation to calculate the probability of hitting your Stop Loss or Take Profit levels across different time horizons (expressed in bars).
It provides data-driven insights to optimize your risk management and position sizing by showing Expected Value for each scenario.
As a quant, I love using statistical data to help my decisions and get better EV from my trades.
🔬 How It's Calculated
Monte Carlo Simulation: Runs 1,000-10,000 price simulations using a random walk model
Volatility Analysis: Combines ATR-based and Historical Volatility for accurate price movement modeling
Expected Value: Calculates profit/loss expectation using formula: (TP_Probability × Reward) - (SL_Probability × Risk)
Time Horizons: Tests multiple timeframes (1, 5, 10, 20, 50 bars) to find optimal holding periods
Risk/Reward Ratios: Automatically calculates and displays R:R ratios for quick assessment
💡 Use Cases
Position Sizing - Determine optimal risk per trade based on Expected Value
Time Horizon Optimization - Find the best holding period for your strategy
Stop Loss Placement - Validate SL levels using probability analysis
Take Profit Optimization - Set TP levels with statistical backing
Strategy Backtesting - Compare different R:R setups before entering trades
Risk Management - Avoid trades with negative Expected Value
Swing vs Day Trading - Choose timeframes with highest success probability
🎯 How to Use
Setup Trade: Enter your entry price, stop loss, and take profit levels
You can add or remove time horizons denominated in bars. Say you are looking at 1h candles, adding a 24-bar time horizon means you are looking into 24 hours
Choose Direction: Select Long or Short position
Review Table
Analyze Expected Value: Focus on positive EV scenarios (green background)
Optimize Timing: Select time horizons with best risk/reward profile
Adjust Parameters: Modify volatility calculation method and simulation count if needed
Examples
Here's how you can read the tables.
Example 1:
In this chart, we are analyzing the TP and SL probabilities as well as the EV (expected value) for a stock. I want to check what the likelihood is that my SL and TP get triggered over the next 5 days. The stock market is open for 6.5 hours per day, which is 13 bars in this 30-minute bar chart. 26 bars is 2 days, 39 bars is 3 days and so on.
Although this trade is more likely to trigger my SL than my TP, in some of the time horizons we have a positive expected value because of the risk/reward of our trade (i.e. distance of the SL and TP from the price) and the probability of hitting SL and TP.
Example 2:
In this example, we have applied the indicator to gold. Because the TP is much closer to the price, the probability of hitting the TP is much higher.
We can also observe that the expected Value in the shorter time frames is better than in the longer ones. This can give us some clues to set up our trade. If we know that the EV is positive, we can allocate more to that specific trade.
Enjoy, and please let me know your feedback! 😊🥂

[Stop!Loss] ADR Signal ADR Signal - a technical indicator located in a separate window, which displays by default the 80%-level , as well as the 100%-level of the average daily range (ADR) for the last 10 days and compares it with the current intraday range. The indicator helps not only with the use of a mathematical-statistical method to identify a potential reversal at the moment during intraday trading, but can also serves as an effective assistant in risk management.
👉 Basic mechanics of the indicator
Firstly, this indicator tracks the performance of the standard ATR indicator on the daily chart, in other words, ADR (Average Daily Range).
Important ❗️The ATR (Average True Range) indicator was created by J. Welles Wilder Jr. He first introduced ATR in his book "New Concepts in Technical Trading Systems", published in 1978. Wilder developed this indicator to measure market volatility to help traders estimate the range of price movements. This indicator is built into TradingView, more details can be found by link: www.tradingview.com
Like ATR , ADR calculates the average true range for a specified period. In this case, the distance in points from the maximum of each day to its minimum is calculated, after which the arithmetic mean is calculated - this is ADR .
👉 Visualization
ADR Signal is located in a separate window on the chart and has 3 levels:
1) "ADR level" (green line) - the same parameter, the calculations of which are briefly described above. There is 100%-level of ATR on the daily chart (ADR).
2) "Current level" (red line) - this is the current price passage within the day, calculated in points. At the start of a new day, this parameter is reset. Therefore, in the indicator window, this line has sharp drops at the start of a new trading day: "A new trading day - the instrument's power reserve is renewed again".
3) "Signal level" (blue line) - this is an individually customized value that demonstrates a certain part of the ADR parameter.
👉 Inputs
1) - is responsible for the ATR indicator period, the value of which will always be calculated on the daily chart. The default value is "10", that is, ATR is calculated for the last 10 days (not including the current one).
2) - signal level (in %). The default value is "0.8", that is, 80%-level of the ADR parameter (set earlier) is calculated.
👉 Style
1) - by default, this level is colored "blue".
2) - by default, this level is colored "red".
3) - by default, this level is colored "green".
👉 How to use this indicator
Important❗️ The two methods of the use of the ADR Signal indicator described below will be most effective when trading intraday (which is highlighted quite well below), so it is more logical to use the indicator information on time periods H1 and below.
1) Identifying potential reversals during intraday trading:
The ADR Signal indicator can be used as a potential individual reversal strategy.
Important ❗️It should be noted that using it in it without additional confirming analysis tools will be a rather aggressive trading approach. Therefore, it is best to support the entry point in particular with other methods.
In this case, the crossing of the red line (the number of points passed within the current day, that is, from the minimum of the current day to its maximum) and the blue line (color of the Signal level based on the default settings), indicates that the trading instrument has passed 80% (based on the default settings for the "Signal level") of its average distance from the maximum to the minimum over the past 10 days (based on the default settings for the "ADR Length"). Such a situation in the context of the mathematical-statistical approach indicates a probable reversal, since the "power reserve" of this instrument is mostly exhausted, so one can expect with a higher probability, at least, a price stop and possibly a reversal. In case of crossing of the red line and the green one (ADR level), it says again that based on the mathematical-statistical approach, this trading instrument has completely exhausted its intraday "power reserve". In this situation, a stop or reversal of the price will be even more likely.
Of course, using the "Signal level" parameter, one can filter out even more reliable situations for potential price reversals within a day, namely, by specifying, for example, 1.5 in the field of this parameter. Under such conditions, in the case of crossing the red and blue lines (based on the default style settings), to say that the trading instrument has passed 150% of its average distance over the last 10 days (based on the default style settings "ADR length"). In this case, the probability of a stop or reversal of the price increases even more.
2) Use in risk management:
In terms of risk management, this indicator is more applicable to open trades. For example, if one had an open Buy-position (especially if it is an intraday trade) and the price has raised significantly during the day, then the crossing of the red line with the blue line , and especially the red line with the green line , may indicate that the price will most likely stop growing, since the "power reserve" is almost or completely exhausted for this instrument within the current day. In this case, one can, at a minimum, move the trade to breakeven or even partially fix the profit.
We will continue to discuss the methods of using this indicator and strategies based on it here. And we are always waiting for your reactions and feedback on this topic 💬.
Thank you for your support 🚀

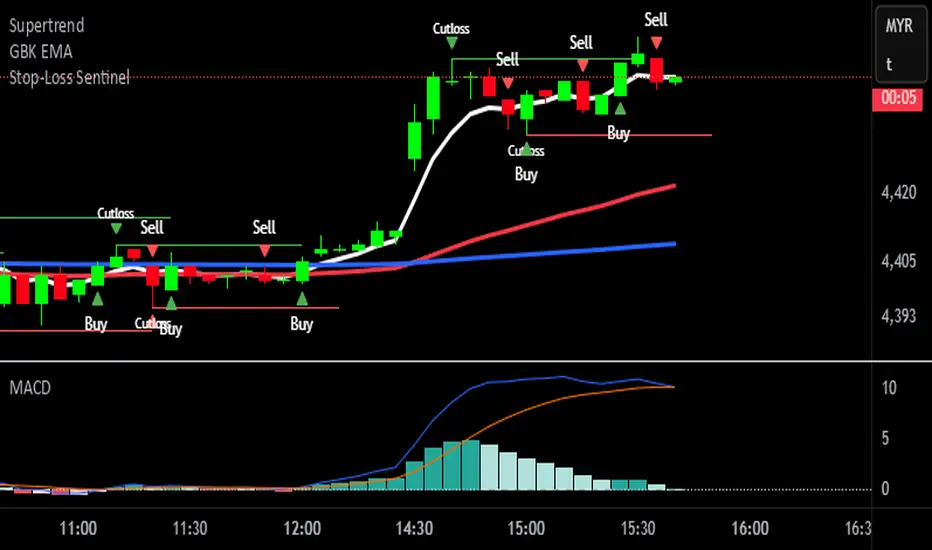
Stop-Loss Sentinel
Cutloss Swing Marker with Adjustable Trend Lines
This indicator identifies swing highs and lows using pivot points.
Swing Highs are marked with a green downward triangle and a "Cutloss" label above the bar.
Swing Lows are marked with a red upward triangle and a "Cutloss" label below the bar.
From each Cutloss point, a horizontal trend line is drawn forward for a set number of bars.
All colors (text, trend lines) and line length are fully adjustable in the settings.
Intended Use:
Helps traders visually mark potential stop-loss or reversal zones and track them over the next few bars. Works on any timeframe, but is designed for fast decision-making on lower timeframes like M1.
Marks key swing highs/lows with ‘Cutloss’ labels and triangles, then extends customizable trend lines for the next bars. Ideal for spotting stop-loss or reversal zones on any timeframe.
Stop Loss IndicatorThe stop loss indicator is a single trade indicator to manage risk
It tells you the size of the trade you should enter and lets you know where to place stops and when and where to trail your stops to based on ATR, given your entry price and risk amount.
Set the date and time once trade is active and once ATR moves above(long)/below(short) entry price you can move your stop loss following the green triangles.
Short
green triangle down => high + (ATR * 1.5)
red triangle up => low + (ATR * 1.5)
Long
green triangle up => low - (ATR * 1.5)
red triangle down => high - (ATR * 1.5)
Stop Loss with ExitsStandard Percentage-based Stop Loss for long and short, with configurable extra exit conditions.
Just copy/paste into your script.
Uses "low" and "high" values for crossing the stop loss threshold, but can be changed to "close" if you prefer (change "low" and "high" on lines 31 and 32 to "close")
Stop Loss and TargetsEnter your purchase price, SL% and up to 3x TP%s. Automatically plots them on your chart to enable quicker set up of alerts.

